主办单位:中国气象局沈阳大气环境研究所
国际刊号:ISSN 1673-503X
国内刊号:CN 21-1531/P

气象与环境学报 ›› 2021, Vol. 37 ›› Issue (5): 20-26.doi: 10.3969/j.issn.1673-503X.2021.05.004

• 论文 • 上一篇    下一篇

湖州市PM2.5浓度变化及传输特征分析

尹浩1(),郯俊岭1,王巨勇2,李洪权3,奚雷1,吴彬1,*(),邱吉东1   

  1. 1. 湖州市气象局, 浙江 湖州 313000
    2. 湖州宇成信息科技有限公司, 浙江 湖州 313000
    3. 德清县气象局, 浙江 德清 313200
  • 收稿日期:2020-08-18 出版日期:2021-10-30 发布日期:2021-11-01
  • 通讯作者: 吴彬 E-mail:1017063454@qq.com;120609631@qq.com
  • 作者简介:尹浩, 男, 1990年生, 工程师, 主要从事天气预报、环境气象和灾害性天气预报技术研究, E-mail: 1017063454@qq.com
  • 基金资助:
    湖州市公益性应用研究项目(2019GZ29)

Analysis of PM2.5 concentration changes and transmission characteristics in Huzhou city

Hao YIN1(),Jun-ling TAN1,Ju-yong WANG2,Hong-quan LI3,Lei XI1,Bin WU1,*(),Ji-dong QIU1   

  1. 1. Huzhou Meteorological Service, Huzhou 313000, China
    2. Huzhou Yucheng Information Technology Co., Ltd, Huzhou 313000, China
    3. Deqing Meteorological Service, Deqing 313200, China
  • Received:2020-08-18 Online:2021-10-30 Published:2021-11-01
  • Contact: Bin WU E-mail:1017063454@qq.com;120609631@qq.com

摘要:

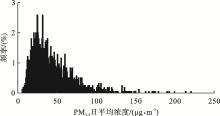
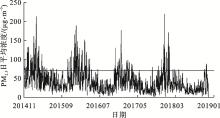
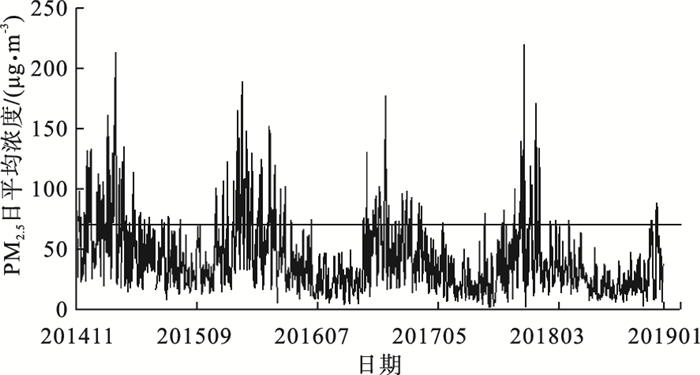
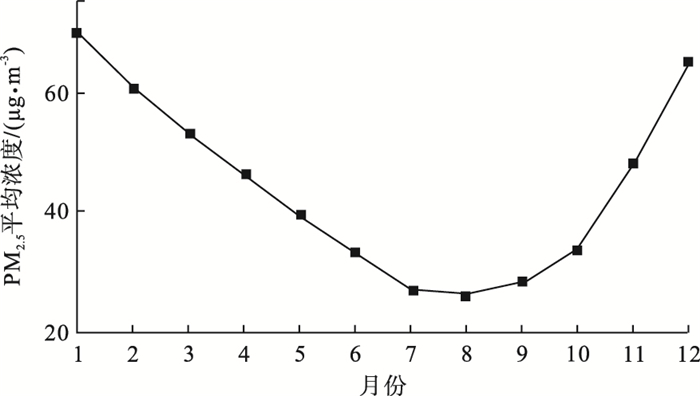
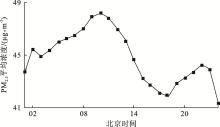
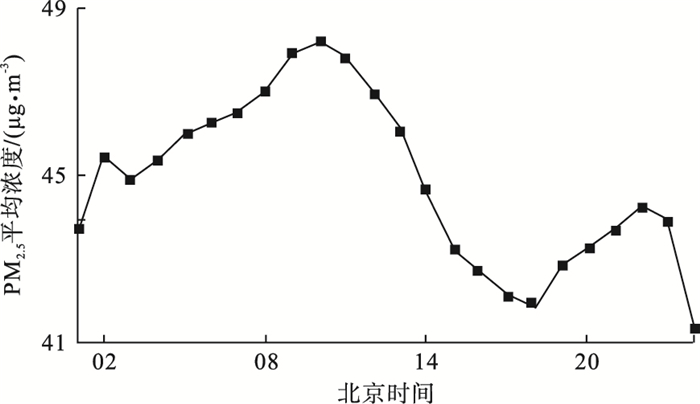
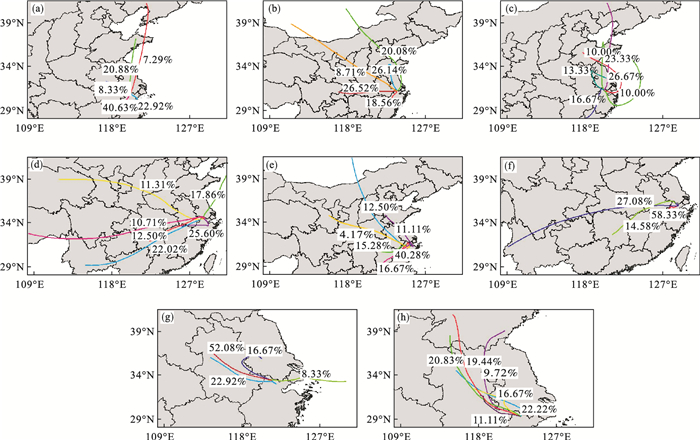
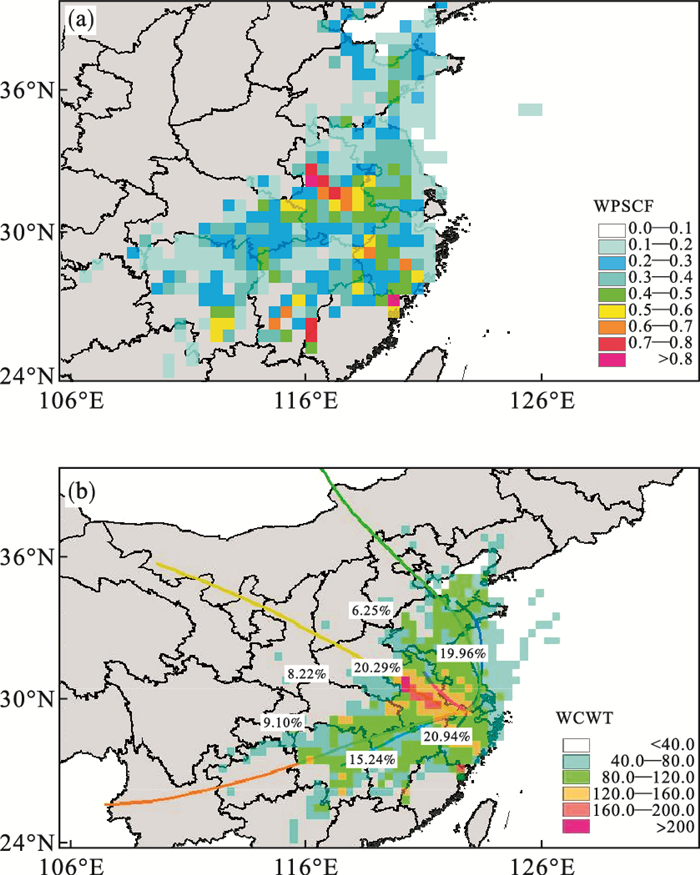
基于2014—2018年全国空气质量指数(AQI)和PM2.5质量浓度数据、美国国家环境预报中心GDAS数据和后向轨迹模式,分析研究了湖州市PM2.5浓度变化特征,并筛选出5 a内出现的8次重污染天气过程进行输送特征和潜在源分析。结果表明:湖州地区PM2.5日平均浓度频率分布呈指数分布,高频区主要集中在20—40 μg·m-3之间。污染主要出现在冬季,夏季、初秋为低浓度值,PM2.5小时平均浓度的日变化呈主副双峰型分布特征,其中主峰出现在10时,副峰出现在02时,谷值则在18时,其与NO2和SO2的变动有关。污染主要通过西北和偏东路径进行中远距离传输,其中西北路径传输对湖州地区影响较大,而偏东路径下气团经过海面,夹带的水汽与颗粒物充分混合,会加剧颗粒物的二次生成和老化过程;西南偏西路径和偏南路径对湖州空气污染也有一定贡献,但存在不确定性,个别过程中偏南路径表现为清洁通道。西北路径上的城市群是主要潜在源区,大值区主要集中在安徽中西部。

关键词: 重污染天气, PM2.5, 后向轨迹聚类

Abstract:

Based on the National Air Quality Index (AQI), PM2.5 mass concentration data, Global Data Assimilation System (GDAS) meteorological data from 2014 to 2018, and the backward trajectory model, the characteristics of PM2.5 concentration changes in Huzhou city were analyzed. Eight heavy pollution processes that occurred in 5 years were screened out for transportation characteristics and potential source analysis. The results show that the frequency distribution of the daily average concentration of PM2.5 in Huzhou city changes exponentially, and the high-frequency area corresponds mainly concentrations between 20-40 μg·m-3. The pollutant mainly occurs in winter, with low concentration values in summer and early autumn. The diurnal variation of the hourly average concentration presents a bimodal distribution, in which the main peak appears at 10 o'clock, the auxiliary peak appears at 2 o'clock, and the valley is at 18 o'clock. The concentration is related to the change of NO2 and SO2. PM2.5 in Huzhou city is mainly transported along the northwest and east path over a medium and long-distance. Among them, the northwest path transportation has a greater impact on the Huzhou area. The air mass in the eastward path passes over the sea surface, and it is fully mixed with the water vapor, which will aggravate the second generation and aging process of the particulate matter. The southwest-by-west and southerly paths also contribute to Huzhou's air pollution, but uncertainty remains, the southerly path appears as a clean passage in individual cases. The urban agglomeration along the northwest route is the main potential source area, and the high-value area is mainly concentrated in the central and western parts of Anhui province.

Key words: Heavily polluted weather, PM2.5, Huzhou, Backward trajectory clustering

中图分类号: