主办单位:中国气象局沈阳大气环境研究所
国际刊号:ISSN 1673-503X
国内刊号:CN 21-1531/P

气象与环境学报 ›› 2022, Vol. 38 ›› Issue (2): 89-96.doi: 10.3969/j.issn.1673-503X.2022.02.011

• 论文 • 上一篇    下一篇

1971—2018年陕西省人体舒适度日数时空变化特征

雷杨娜(),毛明策,李明,张侠   

  1. 陕西省气候中心, 陕西 西安 710014
  • 收稿日期:2021-09-27 出版日期:2022-04-28 发布日期:2022-04-24
  • 作者简介:雷杨娜, 女, 1983年生, 高级工程师, 主要从事气候变化方面的研究, E-mail: lyn0913@163.com
  • 基金资助:
    陕西省气象局青年科研基金项目(2017Y-4)

The spatio-temporal characteristics of the number of human comfortable days in Shaanxi province during 1971-2018

Yang-na LEI(),Ming-ce MAO,Ming LI,Xia ZHANG   

  1. Climate Center in Shaanxi Province, Xi'an 710014 China
  • Received:2021-09-27 Online:2022-04-28 Published:2022-04-24

摘要:

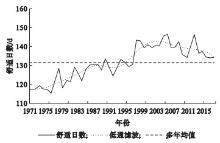
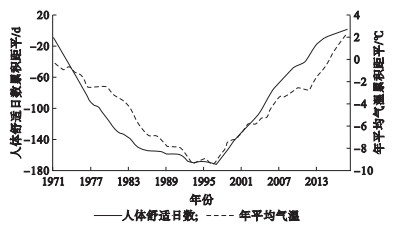
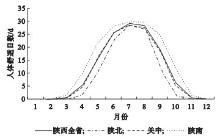
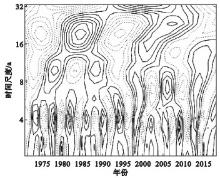
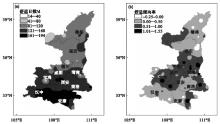
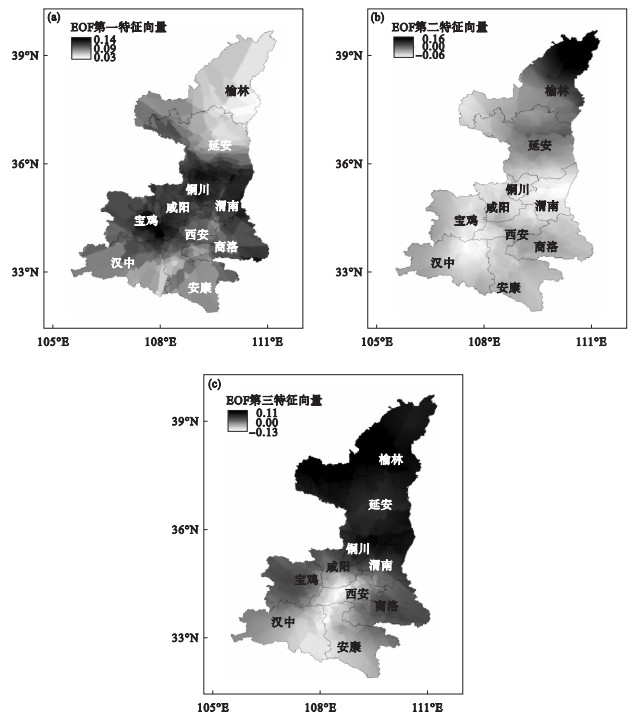
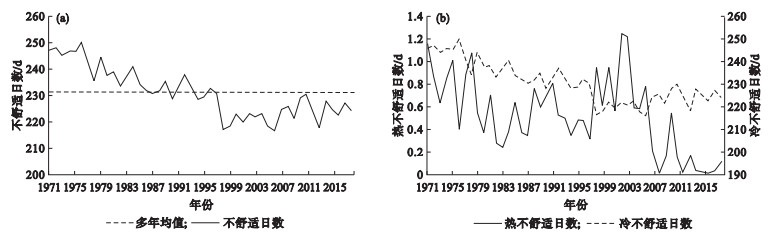
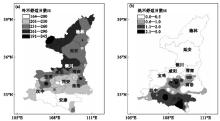
根据1971—2018年陕西省94个气象观测站逐日气象资料,采用线性倾向率、累积距平、小波分析和EOF分析等方法,对陕西省人体舒适度日数时空变化特征进行了统计分析。结果表明: 陕西全省大部分时间体感状态为从冷到舒适,日数占85.2%;体感状态为暖和以上日数较少,无炎热和酷热天气。1981—2018年陕西省平均人体舒适日数为132 d,呈显著增多趋势,线性倾向率为0.524 d·a-1,四季中春、夏两季人体舒适日数增加最为显著。人体舒适日数存在准4 a和准8 a的振荡周期,滑动T检验表明陕西省及三个地区的人体舒适日数均在1997年左右发生了明显的突变。陕西全省3—11月均存在舒适日,舒适日数主要分布在5—9月,陕北7—8月舒适日数较多,陕西中部6—8月舒适日数较多,陕西南部6—9月舒适日数较多。年人体舒适日数呈现南多北少的空间分布特征,陕南汉中和安康地区最多。EOF分析结果显示,年均人体舒适日数异常分布在全省存在一致性。倾向率空间分布表明陕西全省80%的地区人体舒适日数均呈增长趋势,仅榆林北部、延安北部和安康东部11个区县人体舒适日数呈减少趋势。陕西全省不舒适日数变化呈显著减少趋势,倾向率为-0.548 d·a-1,其中冷不舒适日数减少显著。陕西省人体不舒适主要表现为冷不舒适,主要集中在陕北西北部、南部山区和中部的太白和华山两个高山区; 人体热不舒适主要分布在在陕南的汉中和安康地区及关中的西安地区,且日数很少。

关键词: 人体舒适日数, 小波分析, EOF分析

Abstract:

Based on the daily meteorological data from 94 stations in Shaanxi province from 1971 to 2018, the temporal and spatial characteristics of the number of human comfortable days (HCDs) were analyzed using the analytical methods including linear tendency rate, cumulative anomaly, wavelet analysis, and empirical orthogonal function (EOF) analysis.The results indicated that the body feeling status ranges from cold to comfort in most time with the number of days accounting for 85.2 percent of the year.There is a small number of days when the body feels warm and there are no hot and sultry days.The annual mean number of HCDs is 132 d in Shaanxi province from 1971 to 2018 with an increasing linear trend of 0.524 d·a-1.The number of HCDs in spring and summer increases most significantly.There are two periodic oscillations of quasi 4 years and quasi 8 years for the number of HCDs during the studied period.The results of the sliding-T test show that the number of HCDs in Shaanxi province and the three regions occurs significantly abrupt change over 1997.HCDs appear from March to November, and focus mainly on the period from May to September.There is the largest number of HCDs in northern Shaanxi province from July to August, in Guanzhong from June to August, and in southern Shaanxi province from June to September.The number of annual HCDs is larger in the south than in the north, and is the largest in Hanzhong and Ankang.The EOF analysis results show that the abnormal distribution of annual HCDs is consistent across the province.The spatial distribution of the trend displays that the number of HCDs increases in 80% of regions of the province, but decreases in only 11 districts including north Yulin, north Yan'an, and east Ankang.The number of human uncomfortable days in the province shows a significant decreasing trend with a tendency rate of -0.548 d·a-1, and the number of cold uncomfortable days decreases significantly.In addition, the discomfort of the human body in Shaanxi province is mainly manifested as cold discomfort which appears mainly in the northwest of northern Shaanxi province, the southern mountainous areas, and the high mountainous areas of Taibai and Huashan in Guanzhong.However, the region of human thermal discomfort is mainly distributed in Hanzhong and Ankang areas in southern Shaanxi province and Xi'an in Guanzhong, and the number of days is small.

Key words: Human comfortable day, Wavelet analysis, Empirical orthogonal function (EOF) analysis

中图分类号: