主办单位:中国气象局沈阳大气环境研究所
国际刊号:ISSN 1673-503X
国内刊号:CN 21-1531/P

气象与环境学报 ›› 2021, Vol. 37 ›› Issue (4): 78-85.doi: 10.3969/j.issn.1673-503X.2021.04.011

• 论文 • 上一篇    下一篇

1951—2017年鞍山市气温变化特征及城市热岛变化

金巍1,2(),刘卫华3,李晶4,康晓玉1   

  1. 1. 鞍山市气象局, 辽宁 鞍山 114000
    2. 中国科学院空间天气学国家重点实验室, 北京 100190
    3. 大连气象信息中心, 辽宁 大连 116001
    4. 辽宁省气象信息中心, 辽宁 沈阳 110166
  • 收稿日期:2020-03-30 出版日期:2021-08-30 发布日期:2021-09-10
  • 作者简介:金巍, 女, 1968年生, 正研级高级工程师, 主要从事短期天气预报和气候预测研究, E-mail: lnyk_jw@163.com
  • 基金资助:
    辽宁省气象局关键技术项目(LNG201901);2019年中国科学院国家空间科学中心空间天气学国家重点实验室开放课题(Y92612A55S);辽宁省气象局自筹项目(2019XSG11)

Change characteristics of air temperature and urban heat island in Anshan from 1951 to 2017

Wei JIN1,2(),Wei-hua LIU3,Jing LI4,Xiao-yu KANG1   

  1. 1. Anshan Meteorological Service, Anshan, 114000, China
    2. State Key Laboratory of Space Weather, Chinese Academy of Sciences, Beijing 100190, China
    3. Dalian Meteorological Information Center, Dalian, 116001, China
    4. Liaoning Provincial Meteorological Information Center, Shenyang 110166, China
  • Received:2020-03-30 Online:2021-08-30 Published:2021-09-10

摘要:

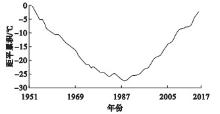
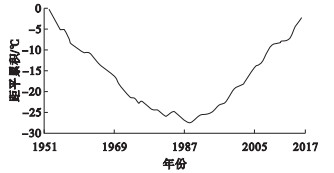
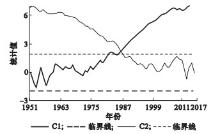
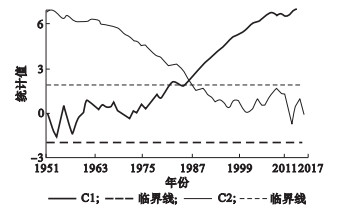
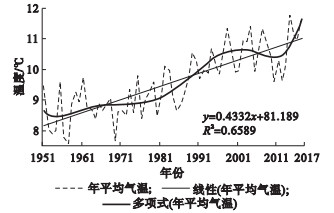
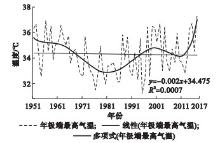
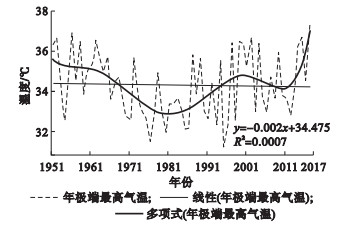
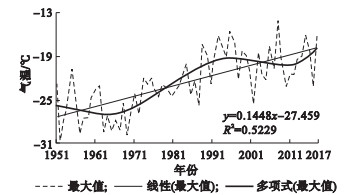
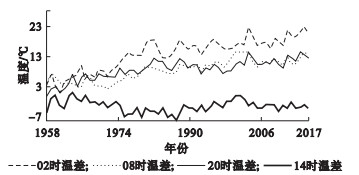
利用建站以来鞍山站和海城乡村站的一日四次观测数据和逐日平均、最低和最高气温资料,对1951-2017年鞍山市年、四季和各月平均气温和极端气温变化特征及其变率进行了分析,并对鞍山城市热岛变化进行探讨。结果表明:1951-2017年鞍山市年平均最低气温的递增趋势最强、平均气温次之、平均最高气温最弱,且均通过显著性检验。1951-2017年鞍山市年极端最高气温变化呈弱递减趋势,1951-1987年(突变前)呈递减趋势、1988-2017年(突变后)为递增趋势。1951-2017年鞍山市年极端最低气温呈显著递增趋势,1951-1987年(突变前)较整个阶段递增趋势更强,1988-2017年(突变后)呈递减趋势;突变前后极端最高和极端最低气温呈反相变化特征。1958-2017年鞍山市年最低气温的城市热岛强度最大、平均气温次之,最高气温最小、递增趋势最弱;秋、冬季鞍山城市热岛强度较其他季节更强,热岛指数递增显著;在每日4次定时气温观测中,14时鞍山市热岛强度最小,热岛指数呈递减趋势,其余时次均呈显著递增趋势,其中,02时鞍山热岛强度最强;鞍山市平均气温变化呈显著增暖趋势,城市热岛强度和热岛指数均呈显著递增,夜间递增尤为突出,说明鞍山城市热岛的显著增强是鞍山市气候变暖的一个主要原因。

关键词: 气温变化, 城市热岛, 突变, 气候变暖

Abstract:

Based on the data of daily mean, minimum and maximum air temperatures observed four times per day in the Anshan region from 1951 to 2017, the change characteristics of the annual, seasonal, and monthly mean air temperatures and extreme air temperatures and their variation ratios as well as the variation of urban heat island were analyzed. The results showed that the increasing trend is strongest for the annual mean minimum air temperature followed by the mean air temperature and is the weakest for the average maximum air temperature in Anshan in the studied period, and all these results have passed the significance test. The annual extreme maximum air temperature in Anshan shows a weak decreasing trend from 1951 to 2017 and experiences a decreasing trend from 1951 to 1987 (before the mutation) and an increasing trend from 1988 to 2017 (after the mutation). Inversely, the annual extreme minimum air temperature shows a significant increasing trend from 1951 to 2017, and a stronger increasing trend from 1951 to 1987 (before the mutation) relative to the former, while shows a decreasing trend from 1988 to 2017 (after the mutation). On the whole, the variations of extreme maximum and minimum air temperatures before and after the mutation are opposite. From 1958 to 2017, urban heat island intensity in Anshan is the largest for annual minimum air temperature, followed by the mean air temperature, and is the smallest for the maximum air temperature with the weakest increasing trend. The intensities of the urban heat island in Anshan in autumn and winter are stronger than in other seasons with a significantly increasing heat island index. Among the four regular temperature observations per day, the intensity of the heat island in Anshan is the smallest at 14 o'clock and the largest at 02 o'clock, and the heat island index shows a decreasing trend at 14 o'clock and a significantly increasing trend at the other times. The mean air temperature in Anshan shows a significantly increasing trend. The intensity of urban heat island and the heat island index in Anshan both increase significantly, especially at nighttime, indicating that the significant increase of the intensity of urban heat islands is one of the main reasons for climate warming in Anshan.

Key words: Air temperature change, Urban heat island, Mutation, Climate warming

中图分类号: