主办单位:中国气象局沈阳大气环境研究所
国际刊号:ISSN 1673-503X
国内刊号:CN 21-1531/P
国际刊号:ISSN 1673-503X
国内刊号:CN 21-1531/P
气象与环境学报 ›› 2023, Vol. 39 ›› Issue (1): 26-36.doi: 10.3969/j.issn.1673-503X.2023.01.004
唐振飞1,2( ),杨婷3,陈笑晨2,李欣欣2,林昕2,何芬2,温珍治2
收稿日期:2021-06-30
出版日期:2023-02-28
发布日期:2023-03-27
作者简介:唐振飞, 男, 1985年生, 高级工程师, 主要从事气候预测和气候变化研究, E-mail: 基金资助:
Zhen-fei TANG1,2(),Ting YANG3,Xiao-chen CHEN2,Xin-xin LI2,Xin LIN2,Fen HE2,Zhen-zhi WEN2
Received:2021-06-30
Online:2023-02-28
Published:2023-03-27
摘要:
基于最新一代CMIP6全球气候模式模拟的历史和未来SSPs排放情景下的逐日降水数据和高分辨率逐日格点观测数据, 采用泰勒图和分位数映射法评估订正模式性能, 计算并分析SSP2—4.5和SSP5—8.5情景下福建省21世纪近期(2021—2040年)、中期(2051—2070年)和末期(2081—2100年)8个极端降水指数的变化。结果表明: 在参照期(1991—2010年)经过分位数映射法偏差订正后, 各极端降水指数模式模拟与观测更加接近, 其空间相关系数、均方根误差和标准差的模拟性能都大幅提升。21世纪各个阶段, 福建省年累积降水量(Prcptot)、极端暴雨日数(R50mm)均多于参照期, 且越到后期、高排放情景下增幅越大。大于10 mm的降水日数(R10mm)和极端大雨日数(R20mm)则是增减各异, R10mm表现为福建东北部减少、其他大部分地区增加, R20mm表现为SSP2—4.5情景下21世纪近期福建西北部减少、而其他情景和时段均增加。表征降水强度的最大1 d降水量(Rx1day)、最大连续5 d降水量(Rx5day)和日降水强度指数(SDII)在未来全部增加, 且沿海地区增幅高于内陆地区。持续干燥指数(CDD)在大部分情形下增加, 表明福建省未来将出现极端降水和持续干燥共同增加的状况, 极端旱涝事件发生的概率将显著增大。
中图分类号:
唐振飞,杨婷,陈笑晨,李欣欣,林昕,何芬,温珍治. SSPs情景下福建省未来极端降水的模拟与预估[J]. 气象与环境学报, 2023, 39(1): 26-36.
Zhen-fei TANG,Ting YANG,Xiao-chen CHEN,Xin-xin LI,Xin LIN,Fen HE,Zhen-zhi WEN. Simulation and prediction of future extreme precipitation in Fujian province under SSPs scenarios[J]. Journal of Meteorology and Environment, 2023, 39(1): 26-36.
表1
6个CMIP6全球气候模式相关信息"
| 序号 | 模式简称 | 研究机构 | 分辨率 |
| 1 | BCC-CSM2-MR | 中国气象局国家气候中心(BCC) | 1.125°×1.125° |
| 2 | EC-Earth3-Veg | 欧盟地球系统模式联盟 | 0.7°×0.7° |
| 3 | GFDL-ESM4 | 美国大气与海洋管理局地球物理流体动力实验室(GFDL) | 1.0°×1.25° |
| 4 | IPSL-CM6A-LR | 法国皮埃尔—西蒙拉普斯研究所(IPSL) | 1.26°×2.5° |
| 5 | MRI-ESM2-0 | 日本气象研究所(MRI) | 1.125°×1.125° |
| 6 | NorESM2-MM | 挪威气候中心(NCC) | 0.94°×1.25° |
表2
极端降水指数定义"
| 指数名称 | 代码 | 定义 | 单位 |
| 年累积降水量 | Prcptot | 日降水量≥ 1 mm的年累积降水量 | mm |
| 大雨日数 | R10mm | 日降水量≥ 10 mm的总日数 | d |
| 极端大雨日数 | R20mm | 日降水量≥ 20 mm的总日数 | d |
| 极端暴雨日数 | R50mm | 日降水量≥50 mm的总日数 | d |
| 最大1日降水量 | RX1day | 最大日降水量 | mm |
| 最大5日降水量 | RX5day | 最大连续5 d降水量 | mm |
| 日降水强度 | SDII | 日降水总量与降水日数之比 | mm·d-1 |
| 持续干燥指数 | CDD | 日降水量<1 mm的最长连续日数 | d |
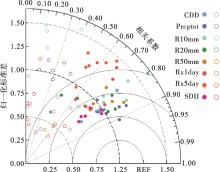
图1
8个极端降水指数历史模拟气候场相对于实况观测的泰勒图 空心圆点表示没有偏差订正,实心圆点表示经过偏差订正的结果"
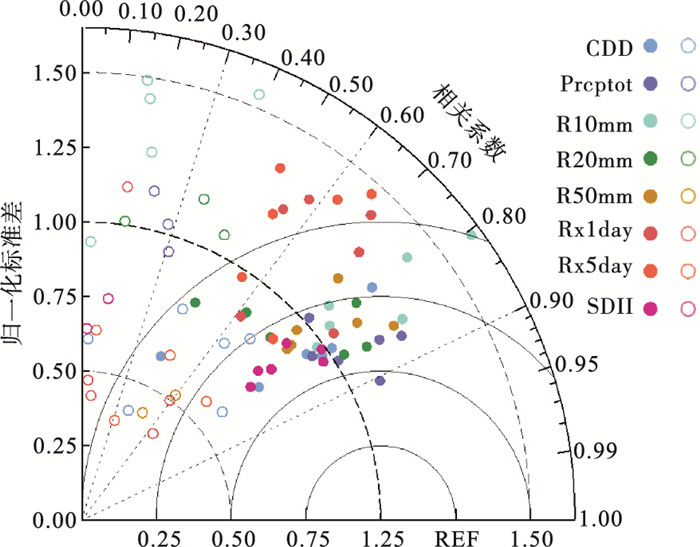
图2
订正后8个指数Prcptot(a)、R10mm(b)、R20mm(c)、R50mm(d)、RX1day(e)、RX5day(f)、SDII(g)和CDD(h)的模式历史气候态"
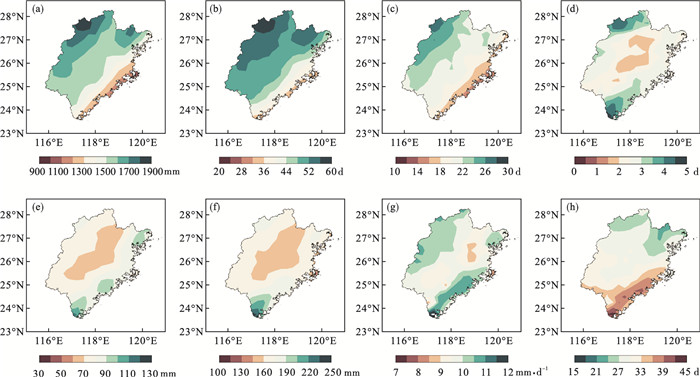
表3
SSP2-4.5和SSP5-8.5情景下未来福建省极端降水指数变化"
| 指数 | SSP2-4.5 | SSP5-8.5 | |||||
| 2021—2040年 | 2051—2070年 | 2081—2100年 | 2021—2040年 | 2051—2070年 | 2081—2100年 | ||
| Prcptot/(%) | 5.26 | 7.02 | 10.25 | 6.43 | 7.21 | 17.46 | |
| R10mm/d | -0.16 | 0.69 | 2.32 | 0.84 | 0.92 | 3.17 | |
| R20mm/d | 0.28 | 0.82 | 1.61 | 0.77 | 0.66 | 2.98 | |
| R50mm/d | 0.50 | 0.67 | 0.86 | 0.42 | 0.76 | 2.19 | |
| RX1day/(%) | 18.46 | 18.52 | 24.01 | 16.49 | 19.81 | 46.60 | |
| RX5day/(%) | 18.29 | 18.59 | 19.79 | 13.80 | 16.99 | 37.19 | |
| SDII/(%) | 3.52 | 5.79 | 7.60 | 3.50 | 6.02 | 17.29 | |
| CDD/(%) | 3.05 | 4.17 | 2.26 | 0.54 | 3.44 | 3.65 | |
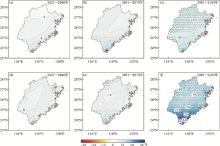
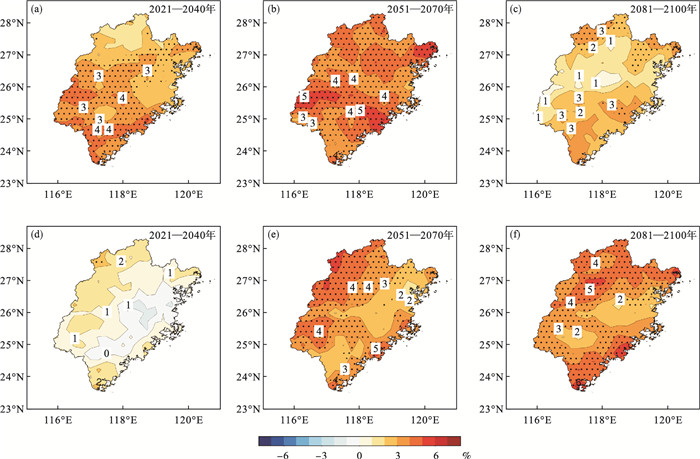
图3
福建省不同时期SSP2-4.5情景(a~c)和SSP5-8.5情景(d~f)极端降水指数Prcptot相对于参照期的空间变化 打点区域为通过显著性检验区域"
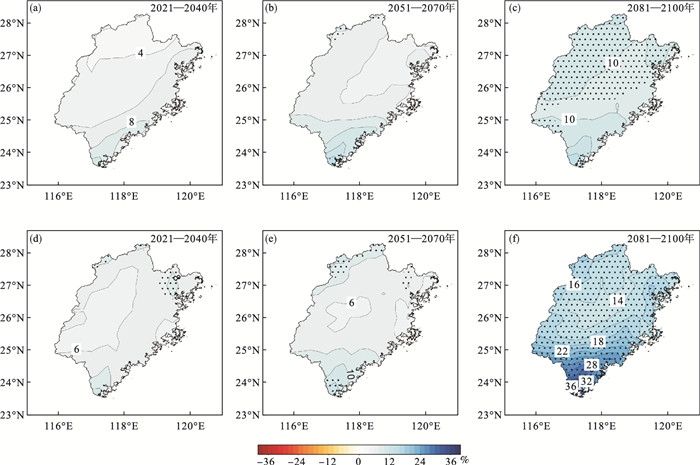
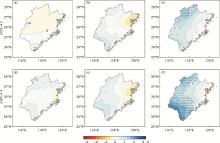
图4
福建省不同时期SSP2-4.5情景(a~c)和SSP5-8.5情景(d~f)下极端降水指数R10mm相对于参照期的空间变化 打点区域为通过显著性检验区域"
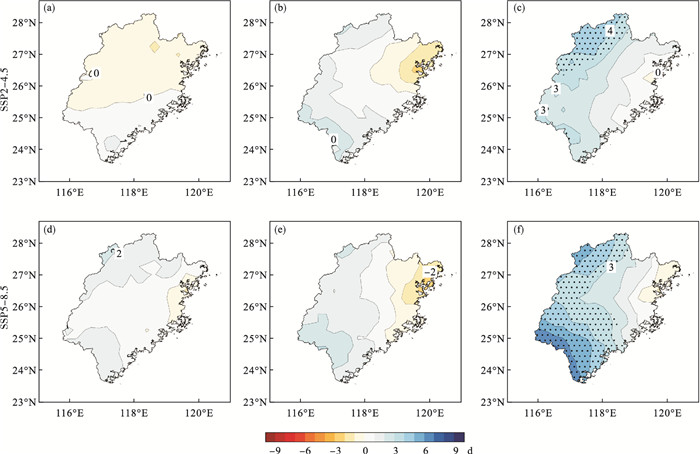
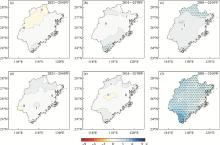
图5
福建省不同时期SSP2-4.5情景(a~c)和SSP5-8.5情景下极端降水指数R20mm相对于参照期的空间变化 打点区域为通过显著性检验区域"
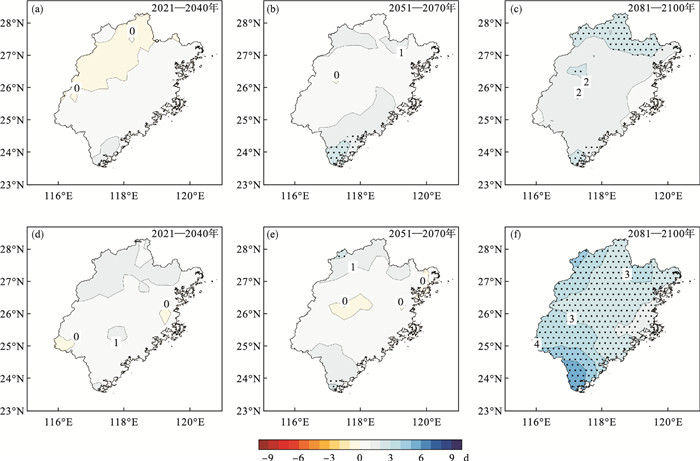
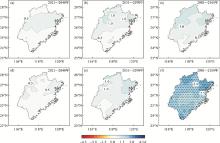
图6
福建省不同时期SSP2-4.5情景(a~c)和SSP5-8.5情景(d~f)下极端降水指数R50mm相对于参照期的空间变化 打点区域为通过显著性检验区域"
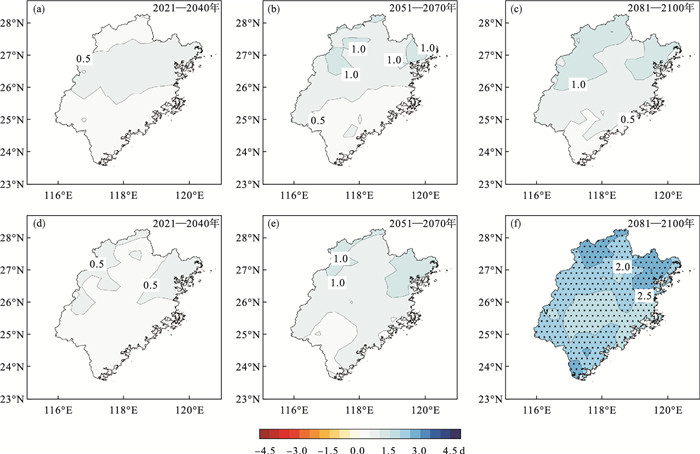
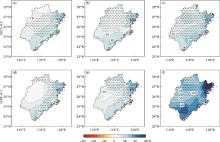
图7
福建省不同时期SSP2-4.5情景(a~c)和SSP5-8.5情景(d~f)下极端降水指数Rx1day相对于参照期的空间变化 打点区域为通过显著性检验区域"
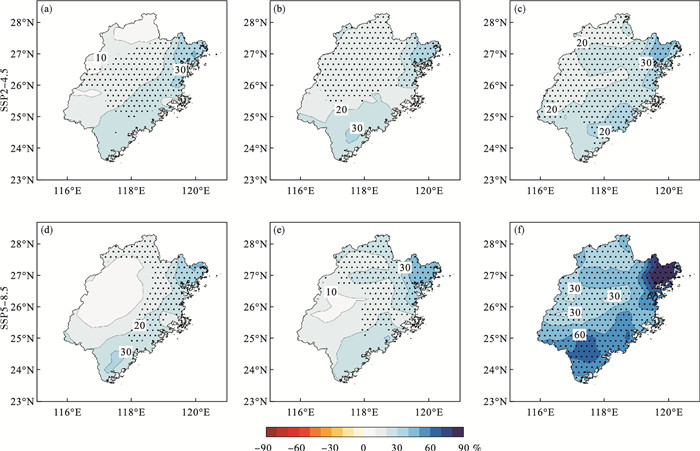
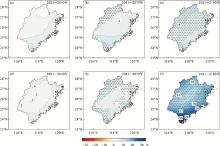
图8
福建省不同时期SSP2-4.5情景(a~c)和SSP5-8.5情景(d~f)下极端降水指数SDII相对于参照期的空间变化 打点区域为通过显著性检验区域"
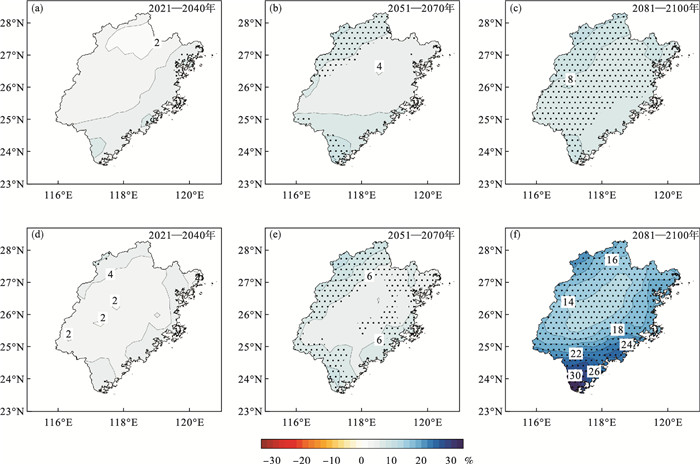
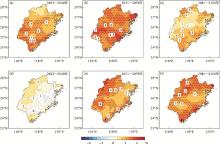
图9
福建省不同时期SSP2-4.5情景(a~c)和SSP5-8.5情景下(d~f)极端降水指数CDD相对于参照期的空间变化 打点区域为通过显著性检验区域"
| 1 | IP CC . Climate change 2013:The physical science basis: working group Ⅰ contribution to the fifth assessment report of the intergovernmental panel on climate change[M]. Cambridge: Cambridge University Press, 2013. |
| 2 | Meehl G A , Arblaster J M , Tebaldi C . Understanding future patterns of increased precipitation intensity in climate model simulations[J]. Geophysical Research Letters, 2005, 32 (18): L18719. |
| 3 |
Allen M R , Ingram W J . Constraints on future changes in climate and the hydrologic cycle[J]. Nature, 2002, 419 (6903): 224- 232.
doi: 10.1038/nature01092 |
| 4 |
Ziegler A D , Sheffield J , Maurer E P , et al. Detection of intensification in global-and continental-scale hydrological cycles: temporal scale of evaluation[J]. Journal of Climate, 2003, 16 (3): 535- 547.
doi: 10.1175/1520-0442(2003)016<0535:DOIIGA>2.0.CO;2 |
| 5 | You Q L , Kang S C , Aguilar E , et al. Changes in daily climate extremes in China and their connection to the large scale atmospheric circulation during 1961-2003[J]. Climate Dynamics, 2011, 36 (11/12): 2399- 2417. |
| 6 |
Li J , Zhao Y , Tang Z F . Projection of Future summer precipitation over the Yellow River Basin: a moisture budget perspective[J]. Atmosphere, 2020, 11 (12): 1307.
doi: 10.3390/atmos11121307 |
| 7 |
许佳琦, 周永吉, 姜丽霞, 等. 1965—2014年黑龙江省洪涝灾害时空演变特征[J]. 气象与环境学报, 2020, 36 (3): 41- 48.
doi: 10.3969/j.issn.1673-503X.2020.03.006 |
| 8 |
Easterling D R , Evans J L , Groisman P Y , et al. Observed variability and trends in extreme climate events: a brief review[J]. Bulletin of the American Meteorological Society, 2000, 81 (3): 417- 426.
doi: 10.1175/1520-0477(2000)081<0417:OVATIE>2.3.CO;2 |
| 9 |
Zhai P M , Zhang X B , Wan H , et al. Trends in total precipitation and frequency of daily precipitation extremes over China[J]. Journal of Climate, 2005, 18 (7): 1096- 1108.
doi: 10.1175/JCLI-3318.1 |
| 10 |
江志红, 陈威霖, 宋洁, 等. 7个IPCC AR4模式对中国地区极端降水指数模拟能力的评估及其未来情景预估[J]. 大气科学, 2009, 33 (1): 109- 120.
doi: 10.3878/j.issn.1006-9895.2009.01.10 |
| 11 |
林昕, 高建芸, 张容焱, 等. 基于定量化指标的福建前汛期降水强度特征分析[J]. 暴雨灾害, 2014, 33 (3): 297- 303.
doi: 10.3969/j.issn.1004-9045.2014.03.013 |
| 12 | IP CC . Climate change 2007:The physical science basis[M]. Cambridge: Cambridge University Press, 2007. |
| 13 |
敖雪, 翟晴飞, 崔妍, 等. 不同升温情景下中国东北地区平均气候和极端气候事件变化预估[J]. 气象与环境学报, 2020, 36 (5): 40- 51.
doi: 10.3969/j.issn.1673-503X.2020.05.006 |
| 14 |
尹晓东, 董思言, 韩振宇, 等. 未来50a长江三角洲地区干旱和洪涝灾害风险预估[J]. 气象与环境学报, 2018, 34 (5): 66- 75.
doi: 10.3969/j.issn.1673-503X.2018.05.009 |
| 15 | 尹红, 孙颖. 基于ETCCDI指数2017年中国极端温度和降水特征分析[J]. 气候变化研究进展, 2019, 15 (4): 363- 373. |
| 16 | Alexander L V , Zhang X , Peterson T C , et al. Global observed changes in daily climate extremes of temperature and precipitation[J]. Journal of Geophysical Research: Atmospheres, 2006, 111 (Z5): D05109. |
| 17 | Sillmann J , Roeckner E . Indices for extreme events in projections of anthropogenic climate change[J]. Climatic Change, 2008, 86 (1/2): 83- 104. |
| 18 |
Sillmann J , Kharin V V , Zwiers F W , et al. Climate extremes indices in the CMIP5 multimodel ensemble: part 2.Future climate projections[J]. Journal of Geophysical Research: Atmospheres, 2013, 118 (6): 2473- 2493.
doi: 10.1002/jgrd.50188 |
| 19 | Andrys J , Kala J , Lyons T J . Regional climate projections of mean and extreme climate for the Southwest of western Australia (1970-1999 compared to 2030-2059)[J]. Climate Dynamics, 2017, 48 (5/6): 1723- 1747. |
| 20 |
Akinsanola A A , Kooperman G J , Pendergrass A G , et al. Seasonal representation of extreme precipitation indices over the United States in CMIP6 present-day simulations[J]. Environmental Research Letters, 2020, 15 (9): 094003.
doi: 10.1088/1748-9326/ab92c1 |
| 21 | 任正果, 张明军, 王圣杰, 等. 1961-2011年中国南方地区极端降水事件变化[J]. 地理学报, 2014, 69 (5): 640- 649. |
| 22 | 郭湘宇, 吴正方, 杜海波, 等. 福建省极端降水时空变化特征及其环流因素分析[J]. 资源科学, 2017, 39 (6): 1084- 1098. |
| 23 |
Moss R H , Edmonds J A , Hibbard K A , et al. The next generation of scenarios for climate change research and assessment[J]. Nature, 2010, 463 (7282): 747- 756.
doi: 10.1038/nature08823 |
| 24 |
张海娜, 侯依玲, 赵春雨, 等. CCSM4模式对东北气温和降水的模拟及预估[J]. 气象与环境学报, 2019, 35 (1): 72- 78.
doi: 10.3969/j.issn.1673-503X.2019.01.010 |
| 25 |
Jiang Z H , Li W , Xu J J , et al. Extreme precipitation indices over China in CMIP5 models.Part Ⅰ: model evaluation[J]. Journal of Climate, 2015, 28 (21): 8603- 8619.
doi: 10.1175/JCLI-D-15-0099.1 |
| 26 | 陈活泼. CMIP5模式对21世纪末中国极端降水事件变化的预估[J]. 科学通报, 2013, 58 (8): 743- 752. |
| 27 | 吴佳, 周波涛, 徐影. 中国平均降水和极端降水对气候变暖的响应: CMIP5模式模拟评估和预估[J]. 地球物理学报, 2015, 58 (9): 3048- 3060. |
| 28 | 周文翀, 韩振宇. CMIP5全球气候模式对中国黄河流域气候模拟能力的评估[J]. 气象与环境学报, 2018, 34 (6): 42- 55. |
| 29 | Eyring V , Bony S , Meehl G A , et al. Overview of the coupled model intercomparison project phase 6(CMIP6)experimental design and organization[J]. Geoscientific Model Development, 2016, 9 (5): 1937- 1958. |
| 30 | 赵宗慈, 罗勇, 黄建斌. 从检验CMIP5气候模式看CMIP6地球系统模式的发展[J]. 气候变化研究进展, 2018, 14 (6): 643- 648. |
| 31 | 张丽霞, 陈晓龙, 辛晓歌. CMIP6情景模式比较计划(ScenarioMIP)概况与评述[J]. 气候变化研究进展, 2019, 15 (5): 519- 525. |
| 32 | 周天军, 邹立维, 陈晓龙. 第六次国际耦合模式比较计划(CMIP6)评述[J]. 气候变化研究进展, 2019, 15 (5): 445- 456. |
| 33 | 周天军, 陈梓明, 邹立维, 等. 中国地球气候系统模式的发展及其模拟和预估[J]. 气象学报, 2020, 78 (3): 332- 350. |
| 34 | Chen H P , Sun J Q , Lin W Q , et al. Comparison of CMIP6 and CMIP5 models in simulating climate extremes[J]. Science Bulletin, 2020, 65 (17): 1415- 1418. |
| 35 | Xin X G , Wu T W , Zhang J , et al. Comparison of CMIP6 and CMIP5 simulations of precipitation in China and the East Asian summer monsoon[J]. International Journal of Climatology, 2020, 40 (15): 6423- 6440. |
| 36 | Fu Y H , Lin Z D , Wang T . Simulated relationship between wintertime ENSO and East Asian summer rainfall: from CMIP3 to CMIP6[J]. Advances in Atmospheric Sciences, 2021, 38 (2): 221- 236. |
| 37 | Jiang D B , Hu D , Tian Z P , et al. Differences between CMIP6 and CMIP5 models in simulating climate over China and the East Asian monsoon[J]. Advances in Atmospheric Sciences, 2020, 37 (10): 1102- 1118. |
| 38 | Zhu H H , Jiang Z H , Li J , et al. Does CMIP6 inspire more confidence in simulating climate extremes over China?[J]. Advances in Atmospheric Sciences, 2020, 37 (10): 1119- 1132. |
| 39 | 向竣文, 张利平, 邓瑶, 等. 基于CMIP6的中国主要地区极端气温/降水模拟能力评估及未来情景预估[J]. 武汉大学学报(工学版), 2021, 54 (1): 46- 57. 46-57, 87 |
| 40 | 苏志重, 石顺吉, 张伟, 等. 1960—2010年福建省极端降水事件变化趋势分析[J]. 暴雨灾害, 2016, 35 (2): 166- 172. |
| 41 | 吴佳, 高学杰. 一套格点化的中国区域逐日观测资料及与其它资料的对比[J]. 地球物理学报, 2013, 56 (4): 1102- 1111. |
| 42 | Zhu H H , Jiang Z H , Li L . Projection of climate extremes in China, an incremental exercise from CMIP5 to CMIP6[J]. Science Bulletin, 2021, 66 (24): 2528- 2537. |
| 43 | Taylor K E . Summarizing multiple aspects of model performance in a single diagram[J]. Journal of Geophysical Research: Atmospheres, 2001, 106 (Z7): 7183- 7192. |
| 44 | 童尧, 高学杰, 韩振宇, 等. 基于RegCM4模式的中国区域日尺度降水模拟误差订正[J]. 大气科学, 2017, 41 (6): 1156- 1166. |
| 45 | Zhou T J , Yu R C . Twentieth-Century surface air temperature over China and the globe simulated by coupled climate models[J]. Journal of Climate, 2006, 19 (22): 5843- 5858. |
| [1] | 蒋语童, 谢立勇, 高士博, 于丽杰. 辽宁省滑雪气象条件的特征及变化趋势[J]. 气象与环境学报, 2023, 39(1): 65-72. |
| [2] | 曲学斌, 王彦平, 高绍鑫, 张煦明, 辛孝飞, 敖孟奇. 2000—2020年呼伦贝尔地区归一化植被指数时空变化及其对气候的响应[J]. 气象与环境学报, 2022, 38(5): 57-63. |
| [3] | 孙凤华,刘鸣彦,翟晴飞. 辽河流域气候变化及对径流影响预估与评估分析[J]. 气象与环境学报, 2022, 38(3): 156-161. |
| [4] | 郑小华, 娄盼星, 马永永. 1961—2018年陕西极端气温时空变化特征[J]. 气象与环境学报, 2021, 37(3): 81-87. |
| [5] | 田宝星,刘丹,宫丽娟,赵放,季生太,赵慧颖,于成龙. 西辽河流域归一化植被指数与气象因子相关性分析[J]. 气象与环境学报, 2021, 37(3): 88-93. |
| [6] | 崔妍,敖雪,曹经福,周晓宇,李明财,赵春雨,刘鸣彦,林蓉. 气候变化对中国东北地区典型城市办公建筑能耗的影响[J]. 气象与环境学报, 2021, 37(1): 91-99. |
| [7] | 崔妍,敖雪,周晓宇,王涛,林蓉,赵春雨,刘鸣彦,易雪. 城市适应气候变化能力评价—以朝阳市为例[J]. 气象与环境学报, 2020, 36(6): 122-129. |
| [8] | 敖雪, 翟晴飞, 崔妍, 周晓宇, 赵春雨, 张晋广, 袁健. 基于OMR方法的城市化进程对辽宁省气温变化的影响分析[J]. 气象与环境学报, 2020, 36(4): 28-35. |
| [9] | 杨艳娟,曹经福,李明财,陈跃浩. 气候变化对中国华北地区办公建筑供热制冷能耗的影响评估[J]. 气象与环境学报, 2020, 36(4): 95-103. |
| [10] | 陈跃浩,孙玫玲,曹经福,李明财,张瑞雪,孟凡超. 气候变化对天津市不同节能水平建筑制冷采暖能耗的影响[J]. 气象与环境学报, 2020, 36(3): 98-105. |
| [11] | 杨丽萍,张存厚,代海燕,吕迪波,韩君. 气候变化对阴山北麓木本植物物候期的影响[J]. 气象与环境学报, 2020, 36(1): 102-107. |
| [12] | 侯依玲, 许瀚卿, 杨绚, 赵春雨. 基于NorESM1-M模式的中国东北地区2050s玉米气候生产潜力预估[J]. 气象与环境学报, 2019, 35(4): 100-105. |
| [13] | 吴建国, 徐天莹. 气候变化对河北坝上地区草地土壤风蚀扬尘季节和年排放速率的影响[J]. 气象与环境学报, 2019, 35(3): 68-78. |
| [14] | 孙凤华, 李丽光, 袁健, 刘鸣彦, 谢艳兵, 胡伟. 辽河流域年平均径流对气候变化响应的试验分析[J]. 气象与环境学报, 2018, 34(6): 91-95. |
| [15] | 王玉娟, 刘晓燕, 白爱娟, 祁栋林, 肖宏斌, 欧建芳. 1961-2017年三江源地区极端降雪指数变化特征分析[J]. 气象与环境学报, 2018, 34(6): 108-115. |
| 阅读次数 | ||||||||||||||||||||||||||||||||||||||||||||||||||
|
全文 159
|
|
|||||||||||||||||||||||||||||||||||||||||||||||||
|
摘要 543
|
|
|||||||||||||||||||||||||||||||||||||||||||||||||
|